Debugging
Debugging a Single Query
toSQL
Returns the SQL that would be executed for the current query.
The bindings for the query are represented by question marks (?
) just as when using queryExecute
. qb can replace each question mark with the corresponding cfqueryparam
-compatible struct by passing showBindings = true
to the method.
tap
Executes a callback with the current entity passed to it. The return value from tap
is ignored and the current entity is returned.
While not strictly a debugging method, tap
makes it easy to see the changes to an entity after each call without introducing temporary variables.
dump
A shortcut for the most common use case of tap
. This forwards on the SQL for the current query to writeDump
. You can pass along any writeDump
argument to dump
and it will be forward on. Additionally, the showBindings
argument will be forwarded on to the toSQL
call.
Debugging All Queries
cbDebugger
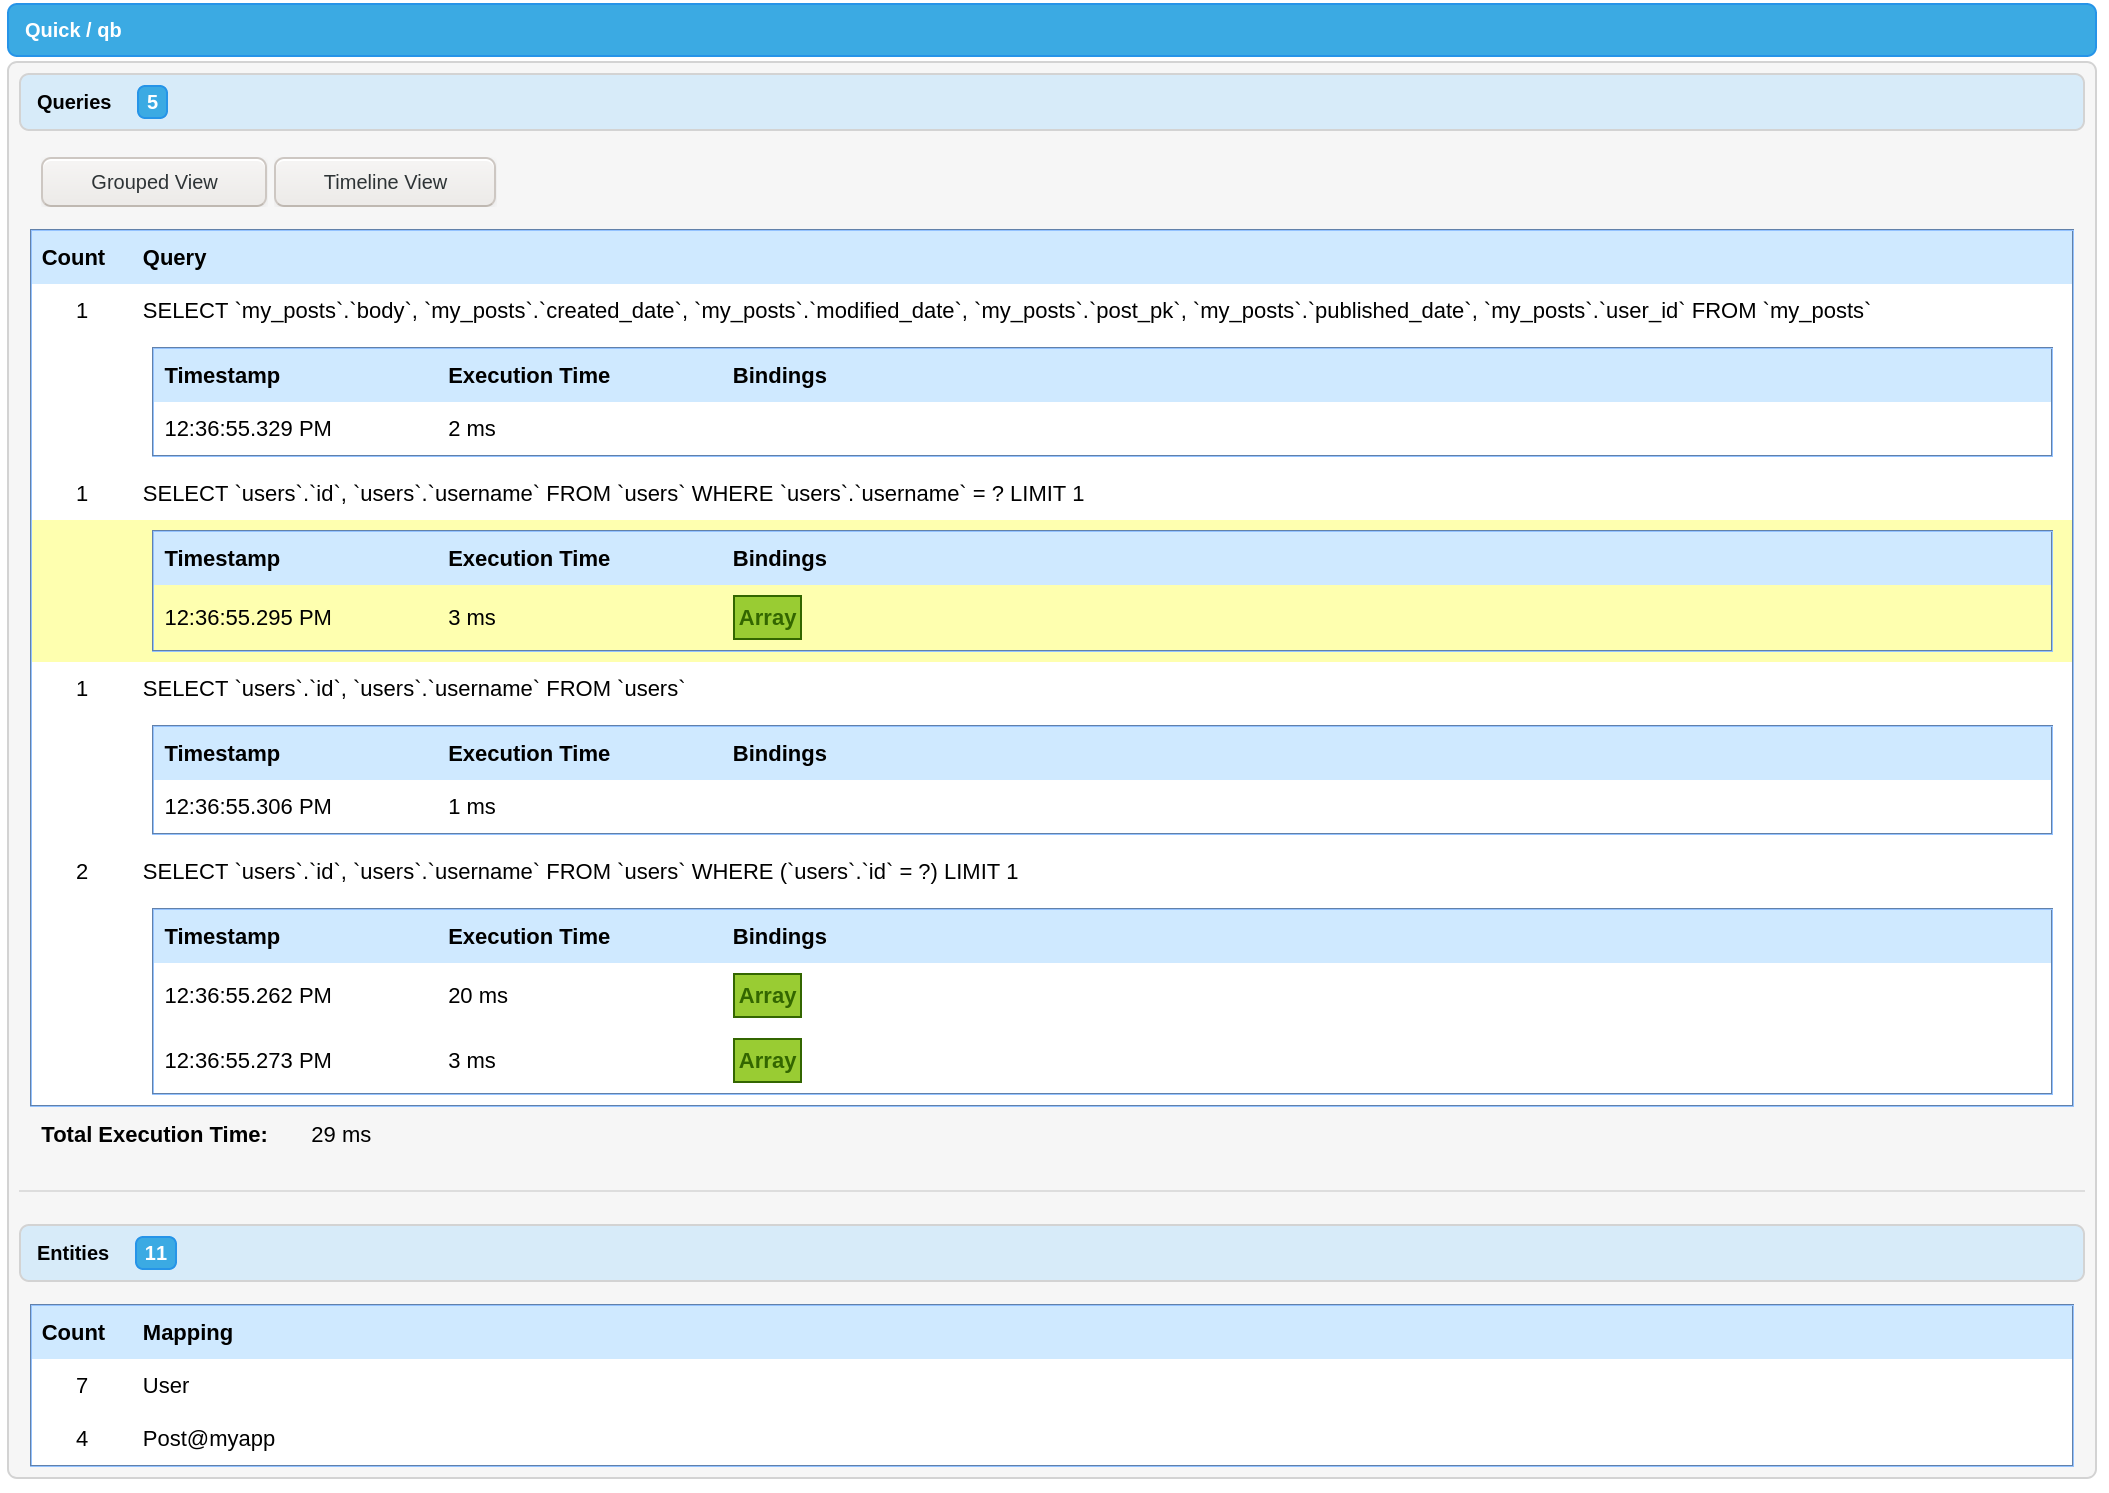
Starting in cbDebugger 2.0.0 you can view all your Quick and qb queries for a request. This is the same output as using qb standalone. This is enabled by default if you have qb installed. Make sure your debug output is configured correctly and scroll to the bottom of the page to find the debug output.
Additionally, with Quick installed you will see number of loaded entities for the request. This can help identify places that are missing pagination or relationships that could be tuned or converted to a subselect.
LogBox Appender
Quick is set to log all queries to a debug log out of the box via qb. To enable this behavior, configure LogBox to allow debug logging from qb's grammar classes.
qb can be quite chatty when executing many database queries. Make sure that this logging is only enabled for your development environments using ColdBox's environment controls.
Interception Points
ColdBox Interception Points can also be used for logging, though you may find it easier to use LogBox. See the documentation for qb's Interception Points or Quick's own interception points for more information.